Source: Used by permission of the BCG Henderson Institute, a division of Boston Consulting Group. All rights reserved.
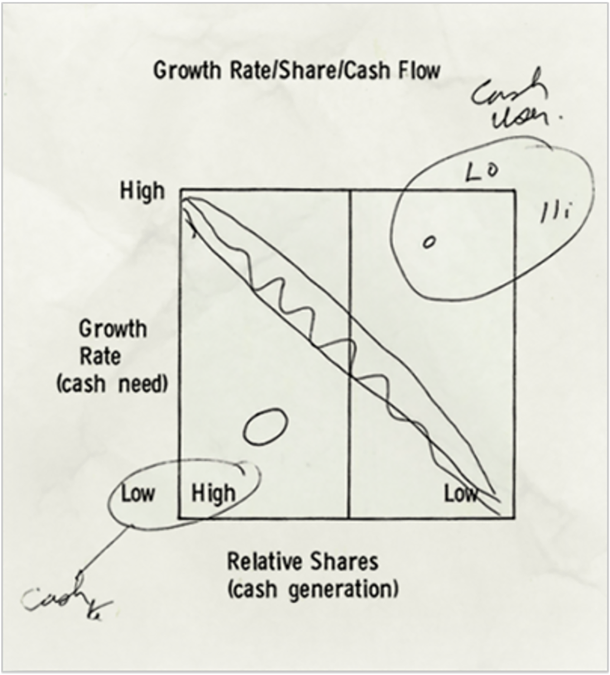
In 1968 BCG was asked to design a simple framework to explain a resource allocation strategy to a client’s board. The matrix’s purpose is clear from the first draft —identify “cash generation” and “cash need” to direct “cash uses”. To make it easier to grasp, the diagonal line was later replaced by four quadrants, each representing a business type. Each quadrant was initially analogized with financial products, before settling for the mnemonically more powerful “cash cow”, “star,” “question mark,” and “pet.” The Growth Share matrix propelled BCG’s business and was at one point used by over half of all Fortune 500 companies.